
01
EFFECT DRAWWING
效果图
02
LANGUAGES
代码语言
1、vue2+echarts静态图表
2、可根据所需要的柱状折线饼图单独抽出使用,每个图表数据耦合
3、支持标准大屏1920px*1080px,
依赖命令如下:
npm i
运行命令如下:
npm run serve
打包命令如下:
npm run build
03
CONSTRUCTION
文件目录结构

可能产生的问题是常见的node版本和sass-loader、scss,可以根据自身电脑的node版本使用sass-loader和scss。
04
DOCUMENTS
DOM部分
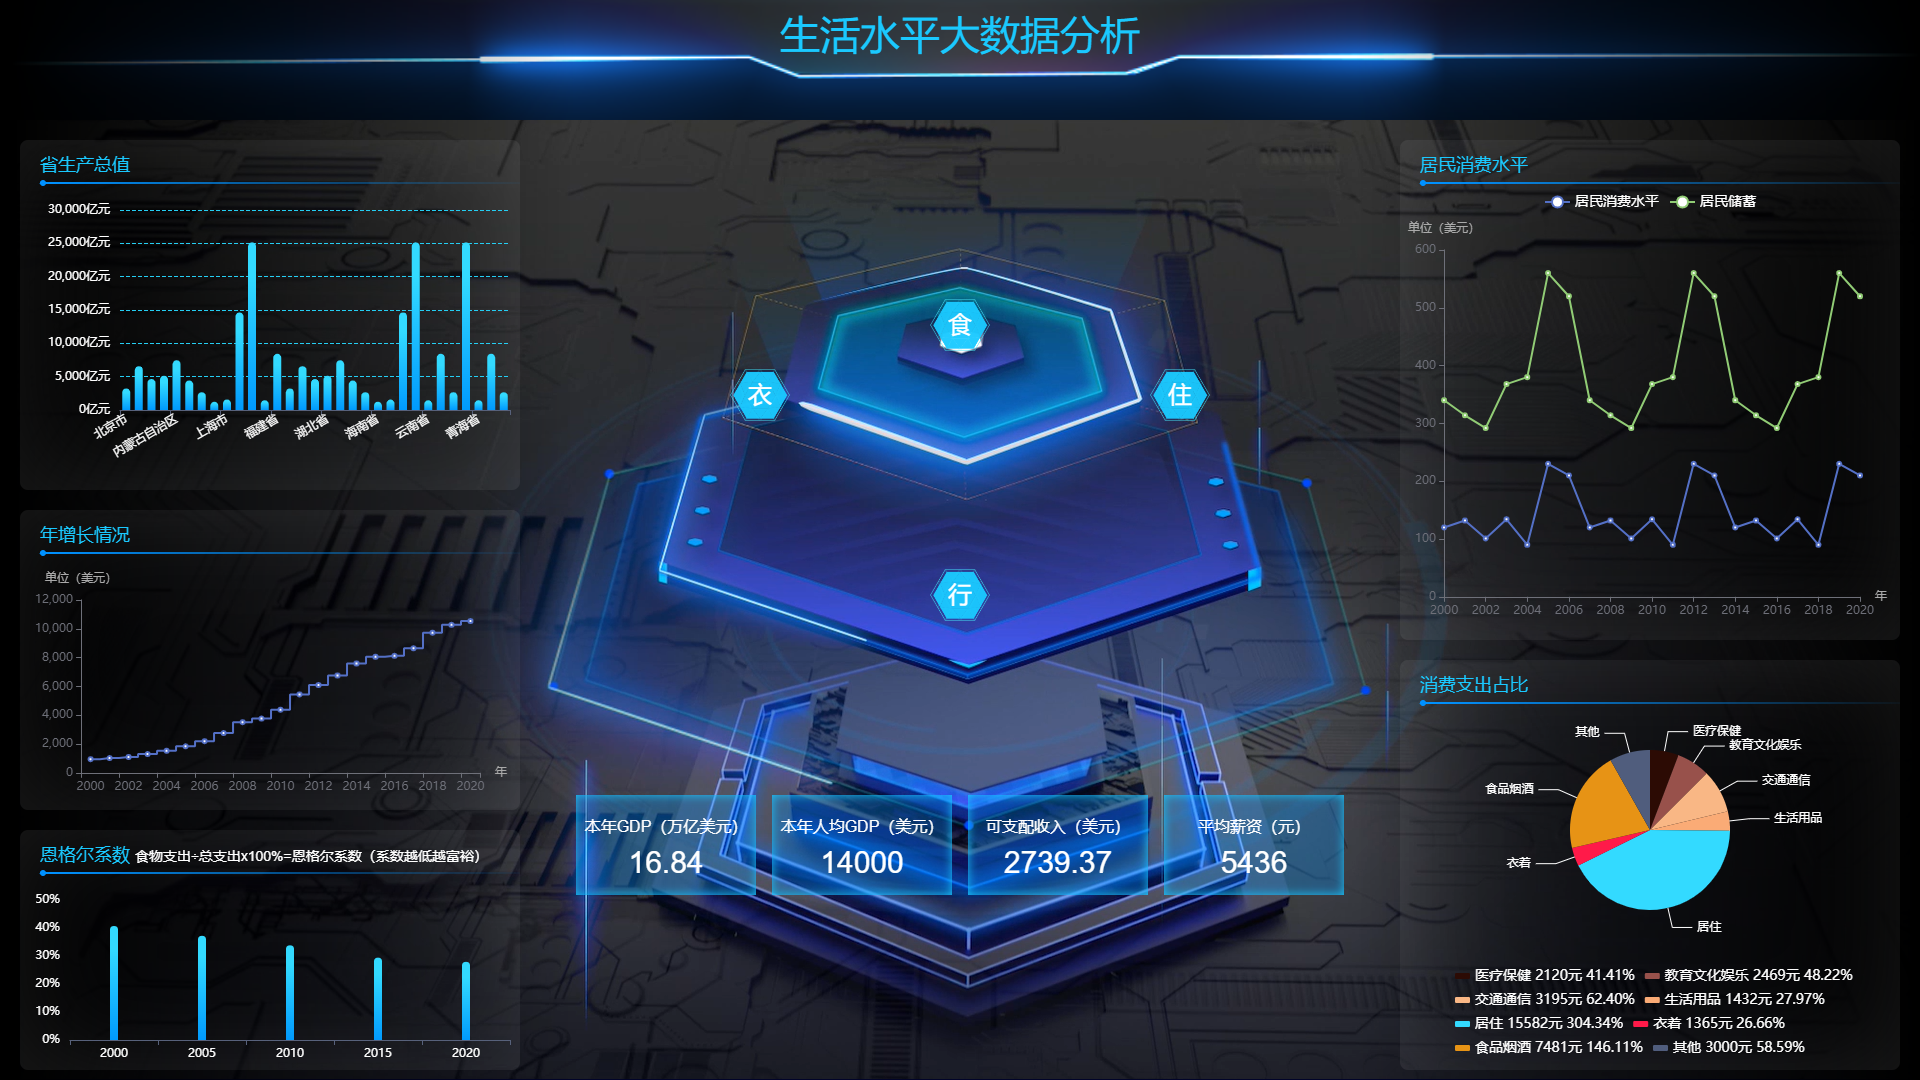
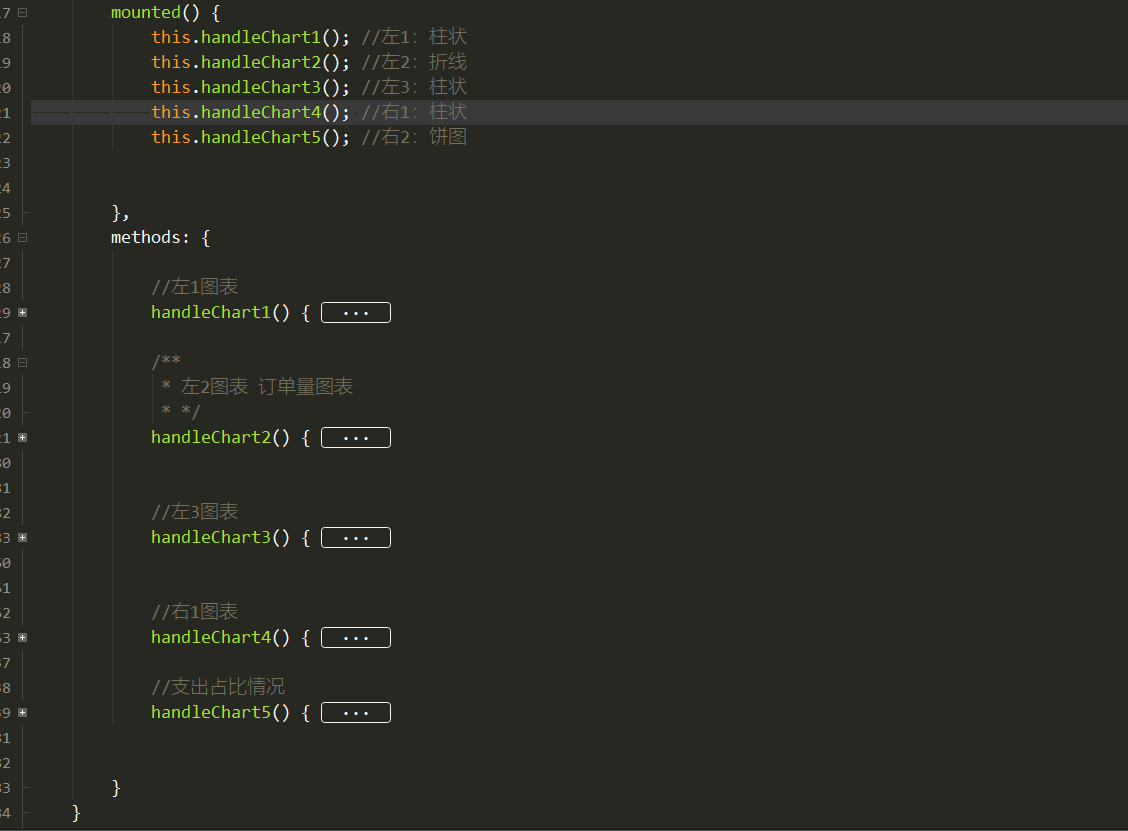
<template>
	<div class="main">
		<!--头部导航 GO-->
		<div class="titbar">
			<span>生活水平大数据分析</span>
		</div>

		<!--主内容区 GO-->
		<section class="maincont">
			<!--左区域 GO-->
			<section class="cont-left">
				<!--左1 GO-->
				<div class="area area1">
					<div class="all-tit">
						省生产总值
					</div>
					<div class="chart" id="chart1">

					</div>

				</div>

				<!--左2 GO-->
				<div class="area area2">
					<div class="all-tit">
						年增长情况
					</div>
					<div class="chart" id="chart2"></div>
				</div>

				<!--左3 GO-->
				<div class="area area3">
					<div class="all-tit">
						恩格尔系数 <span>食物支出÷总支出x100%=恩格尔系数(系数越低越富裕)</span>
					</div>
					<div class="chart" id="chart3"></div>
				</div>
			</section>

			<!--中间六边形 GO-->
			<div class="c-data data1">衣</div>
			<div class="c-data data2">食</div>
			<div class="c-data data3">住</div>
			<div class="c-data data4">行</div>

			<!--中间矩形 GO-->

			<div class="s-data">
				<div class="item">
					<div class="tit">本年GDP(万亿美元)</div>
					<div class="txt">16.84</div>
				</div>
				<div class="item">
					<div class="tit">本年人均GDP(美元)</div>
					<div class="txt">14000</div>
				</div>
				<div class="item">
					<div class="tit">可支配收入(美元)</div>
					<div class="txt">2739.37</div>
				</div>
				<div class="item">
					<div class="tit">平均薪资(元)</div>
					<div class="txt">5436</div>
				</div>
			</div>

			<!--右区域 GO-->
			<section class="cont-right">
				<!--右1 GO-->
				<div class="area area4">
					<div class="all-tit">
						居民消费水平
					</div>
					<div class="chart" id="chart4"></div>
				</div>

				<!--右2 GO-->
				<div class="area area6">
					<div class="item">
						<div class="all-tit">
							消费支出占比
						</div>
						<div class="char" id="chart5"></div>
					</div>
				</div>
			</section>


		</section>

		<!--背景 GO-->
		<div class="video-bg">
			<video autoplay loop muted style="width: 1920px;height: 1080px;" src="../assets/bg.mp4"></video>
		</div>
		<!--背景遮罩 GO-->
		<div class="screen-mask first"></div>
		<div class="screen-mask last"></div>

	</div>
</template>
05
Cascading Style Sheet
CSS部分
//公共标题
	.all-tit {
		margin-left: 20px;
		width: 100%;
		color: #1ac9ff;
		font-size: 18px;
		position: relative;
		height: 50px;
		line-height: 50px;

		&::before {
			width: 6px;
			height: 6px;
			background: #0091ff;
			border-radius: 50%;
			content: '';
			display: block;
			position: absolute;
			bottom: 4px;
			left: 0px;
		}

		&::after {
			width: 100%;
			height: 2px;
			border-radius: 6px 0 0 6px;
			background-image: linear-gradient(90deg, rgb(0, 145, 255) 2%, rgba(0, 145, 255, 0) 100%);
			content: '';
			display: block;
			position: absolute;
			bottom: 6px;
			left: 0px;
		}


	}

	//公共背景
	.area {
		border-radius: 8px;
		box-shadow: inset 0px 0px 100px 0px rgba(255, 255, 255, .1);
		overflow: hidden;
	}

	.main {
		width: 100vw;
		min-height: 100vh;
		background: #010429;
		overflow: hidden;
		position: relative;
		//头部标题 GO
		.titbar {
			width: 100%;
			height: 120px;
			line-height: 50px;
			position: relative;
			text-align: center;
			color: #1ac9ff;
			font-size: 40px;
			background: url("../assets/bg-header.png") center no-repeat;
			background-size: 100% 100%;
			position: relative;
			z-index: 2;

			span {
				position: relative;
				top: 10px;
			}

		}

		.video-bg {
			width: 1920px;
			height: 1080px;
			position: absolute;
			left: 0;
			top: 0;

		}

		.screen-mask {
			background-image: linear-gradient(90deg, rgb(0, 0, 0) 2%, rgba(0, 0, 0, 0) 100%);
			opacity: 1;
			position: absolute;
			width: 30%;
			height: 100%;
			z-index: 3;

			&.first {
				top: 0px;
				left: 0px;
			}

			&.last {
				background-image: linear-gradient(90deg, rgba(0, 0, 0, 0) 2%, rgb(0, 0, 0) 100%, );
				top: 0px;
				right: 0px;
			}
		}

		.maincont {
			position: relative;
			height: calc(100vh - 130px);
			z-index: 5;

			.cont-left {
				width: 500px;
				overflow: hidden;
				position: absolute;
				left: 20px;
				top: 0px;

				.area1 {
					width: 100%;
					margin-top: 20px;

					.chart {
						width: 100%;
						height: 300px;
					}

				}

				.area2 {
					width: 100%;
					height: 300px;
					margin-top: 20px;

					.chart {
						width: 100%;
						height: 240px;
					}
				}

				.area3 {
					width: 100%;
					height: 240px;
					margin-top: 20px;

					.all-tit {
						span {
							font-size: 14px;
							color: #ffffff;
						}
					}

					.chart {
						width: 100%;
						height: 240px;
					}

				}


			}

			.c-data {
				width: 60px;
				height: 60px;
				position: absolute;
				left: 50%;
				top: 50%;
				text-align: center;
				line-height: 60px;
				font-size: 24px;
				color: #ffffff;
				margin: -30px 0 0 -30px;
				background: url('../assets/six.png') center no-repeat;
				background-size: 100% 100%;

				&.data1 {
					margin: -230px 0 0 -230px;
				}

				&.data2 {
					margin: -300px 0 0 -30px;
				}

				&.data3 {
					margin: -230px 0 0 190px;
				}
			}

			.s-data {
				width: 800px;
				height: 100px;
				position: absolute;
				left: 50%;
				top: 50%;
				text-align: center;
				color: #ffffff;
				margin: 200px 0 0 -400px;
				display:flex;
				justify-content: space-evenly;
				.item {
					width: 180px;
					height: 100px;
					background: rgba(0, 145, 255,.3);
					box-shadow: inset 0px 0px 10px 0px rgba(26, 201, 255,1);
					.tit{
						font-size: 16px;
						margin-top: 20px;
					}
					.txt{
						font-size: 30px;
						margin-top: 10px;
					}

				}

			}

			.cont-right {
				width: 500px;
				overflow: hidden;
				position: absolute;
				right: 20px;
				top: 20px;

				.area4 {
					width: 100%;
					height: 500px;
					position: relative;

					.chart {
						width: 100%;
						height: 440px;
					}
				}

				.area6 {
					width: 100%;
					height: 410px;
					display: flex;
					position: relative;
					margin-top: 20px;

					.item {
						position: relative;
						width: 100%;

						.char {
							width: 100%;
							height: 400px;
						}
					}
				}
			}

		}
	}
06
JAVASCRIPT
JS部分
比较长,展示一个示例,可以下载例子包支持下作者,谢谢。
登录情况对已下载过的代码包可以重复下载。如果未登录支付下载,想二次下载,可通过右侧公众号联系客服,绑定登录账号下载。
©软件著作权归平台所有。本站所有软件均来源于本平台开发团队手写代码,供学习使用!
代码使用的结构为开源的VUE+开源的echartJS。
转载请注明出处: codding » 大数据可视化前端模板004


)